Georgetown is taking significant steps to cut our carbon footprint and promote sustainable energy on campus.
Georgetown University is taking significant steps to advance sustainable energy within our campus operations. Since reaching our goal to cut the university’s greenhouse gas emission in half by the year 2020, we are looking to do even more to care for our common home.
In 2008, Georgetown’s President, John J. DeGioia, pledged to reduce the University’s Scope 1 and 2 greenhouse gas emissions by at least 50% from a base year of 2006 by the year 2020. In 2014, Georgetown reduced our carbon footprint by over 71% through a combination of energy efficiency in our facilities and procurement of renewable energy certificates (RECs) for 100% of our power, meeting our GHG goal six years ahead of target. But our work doesn’t stop there. Now, the University continues to actively explore and pursue opportunities to increase our leadership and impact on clean energy and climate, including strategies to further reduce our footprint through a combination of efficiency, conservation and investments in new renewable power.
Explore the links below to learn more about our sustainable energy and greenhouse gas reduction initiatives, and find out how you can get involved.
Our Actions Towards a More Sustainable Georgetown
Energy Partnership: Early April of 2021, Georgetown joined forces with Georgetown Energy Partners providing utility services from ENGIE North America, a global leader in energy services and sustainability, as part of the University’s ongoing efforts to enhance sustainable practices on campus. ENGIE enhances, operates, and maintains the systems that heat, cool and distribute power to the University’s campuses. Georgetown retains ownership of its facilities and control over decisions related to capital improvement.
Increasing our use of renewable energy is an important part of Georgetown University’s approach to reducing our greenhouse gases and creating a sustainable campus. In 2013, Georgetown was recognized as an EPA Green Power Partner of the Year in recognition of our work. Learn more about what we’re doing below!
As of FY13, GU requires green-e certified Renewable Energy Certificates (RECs) for 100% of electricity procured for the Main and Medical campuses. This helps GU meet our LEED green building targets, and makes Georgetown one of the top renewable energy purchasers among universities and college campuses in the US!
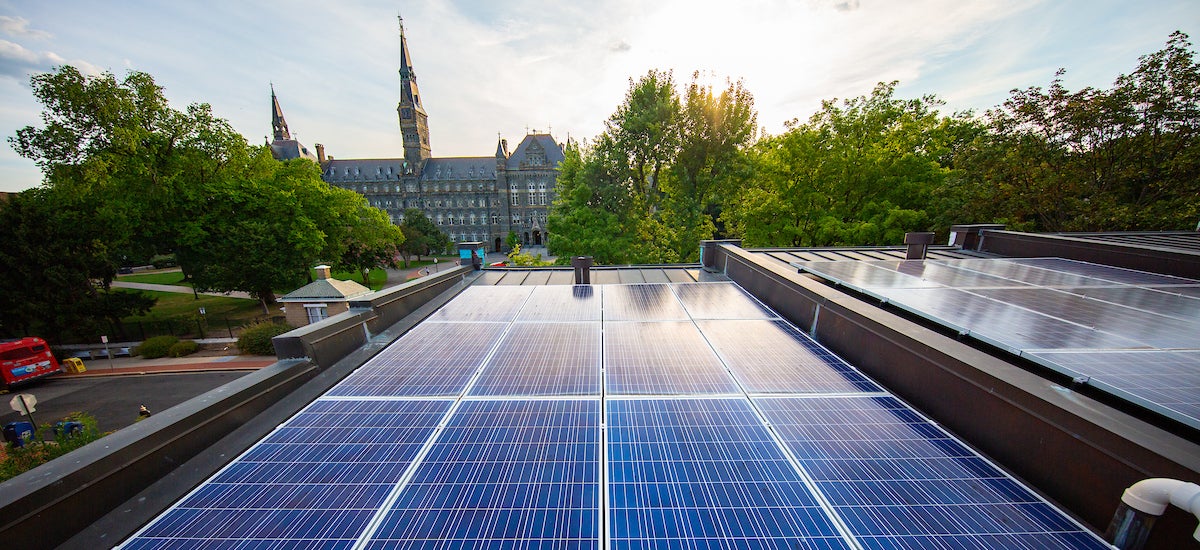
Two-thirds of the university’s electricity needs are provided through a new Power Purchase Agreement (PPA) that launched in October 2020. The 15-year agreement allows Georgetown to annually buy 100,000 megawatt-hours of electricity from 11 existing solar plants. The university purchases the energy without the associated RECs, and through a second financial transaction, purchases Green-e certified renewable energy certificates for the same amount of power for the first five years of the agreement. Learn more about the agreement and explore the Solar Power Purchase Agreement sources.
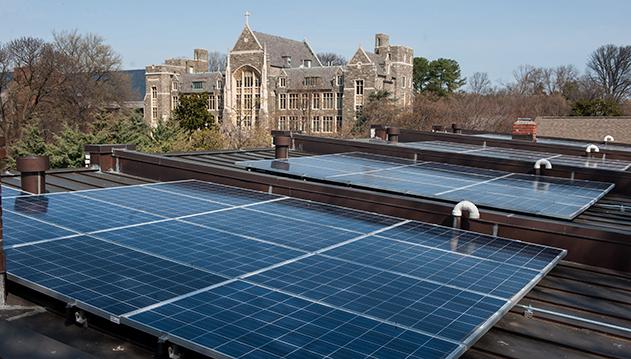
GU’s “Solar Street” project is a student-spearheaded, 18 KW solar PV array on the rooftops of 6 historic rowhouses at the campus’s Main Gates. Solar Street provides the same carbon reduction benefits as planting 333 new trees or removing 44 cars from the road for a year.
The original 300 kW Bunn Intercultural Center solar PV array was installed in 1984, and by 2013 was the longest running installation of its scale at any college campus in the country, producing over 5.8 million kWh over its lifetime. After an impressive 30 year life, the system has been retired.
Through initiatives like our district heating and cooling plant and ongoing building energy retrofits, Georgetown is taking significant steps to cut our energy demand and use energy more efficiently.
Since FY14, the university has invested in a set of efficiency measures that are saving at least 3.3 million kWh of electricity and 82,000 MMBtu of natural gas each year – cutting 5,500 metric tons of CO2 or the equivalent of planting over 140,000 new trees.
Additionally, the department of Planning and Facilities Management pursues energy efficiency and conservation opportunities on an ongoing basis. We also have an ongoing collaboration with the District of Columbia Sustainable Energy Utility to achieve mutual sustainable energy goals.
Explore the links and information below to learn more about our efficiency and conservation work.
Georgetown’s Central Utility Plant supplies the Main and Medical Campuses with district heating and cooling to control temperatures in our buildings. By using centralized boilers and chillers, and piping steam and chilled water across the campus, the university is able to achieve significant efficiencies through scale. We continuously explore and pursue opportunities for further efficiency through centralized equipment upgrades.
Georgetown’s Office of Utilities and Energy Management regularly upgrades the Central Plant, providing ongoing efficiencies. As of FY17, projects like the installation of a new efficient chiller, variable frequency drives for water pumps, utility plant LED lighting retrofits and insulation of chilled water pipes are saving energy at the central plant. A 2014 boiler fan upgrade, steam trap repairs and a de-aerator project also cut an estimated annual 2,508 metric tons of CO2e, equal to taking about 528 cars off the road each year.
Facilities Management implements building energy retrofits as part of their ongoing operations. Examples of recent energy-efficiency retrofits include:
LED-retrofits for lighting in buildings are performed on an ongoing basis as of FY17. Projects include a whole-building LED retrofit of White Gravenor, which is expected to save approximately 200,000 kWh of electricity per year, and LED upgrades in Med-Dent, Hoya Court, and other spaces. To date, LED upgrades have been performed for approximately 500,000 square feet of building area.
In August 2016, Georgetown University completed a retrofit of its Alumni Square residence hall, replacing all of the gas furnaces and air conditioners with more efficient models, and replacing the water heaters in each individual unit with shared, tankless water heaters. As a result of these efficiency upgrades, the University will save nearly $18,000 per year and reduce emissions by 382 tons of CO2 per year, equivalent to the annual emissions of over 36 average homes.
In FY2014, a multi-building steam trap replacement project is saving about 17,000 mmBtu of natural gas and 902 metric tons of CO2e, equal to taking about 190 cars off the road each year.
In FY2012, a lighting retrofit in the Southwest Garage is helping cut an estimated 1 million pounds of CO2 annually, the equivalent of taking about 55 US homes off the grid.
Our energy management team uses a centralized, digital building automation system which allows for the control of temperatures and efficient energy use in campus buildings.
Georgetown participates in regional Demand Response program during hot summer months when energy use peaks. During such events, our utilities team may shut off power to non-critical systems, raise temperature setpoints in unoccupied spaces, and/or take other measures to curtail energy. Combining these central actions with our voluntary energy conservation pledge can save significant amounts of energy, help avoid brownouts, and reduce air pollution.
GU is committed to obtaining LEED Silver or higher for all new construction and major renovations. The LEED rating system includes a significant emphasis on energy efficiency, helping ensure that our new buildings use energy more efficiently.
Commitment to Global Climate Effort: Georgetown has joined with a group of leading research universities in affirming our commitment to a broad-based global agreement on climate change and to doing our part to ensure the United States can meet its contribution.
Georgetown Climate Center: The nonpartisan Georgetown Climate Center seeks to advance effective climate, energy, and transportation policies in the United States— policies that reduce greenhouse gas emissions and help communities adapt to climate change.
Whether through our energy conservation resource guide, available in the “Resources” tab, or through joining one of the many campus organizations dedicated to sustainability, waste reduction, and energy conservation, you can get involved in our efforts to advance sustainable energy on campus and cut our greenhouse gas emissions.